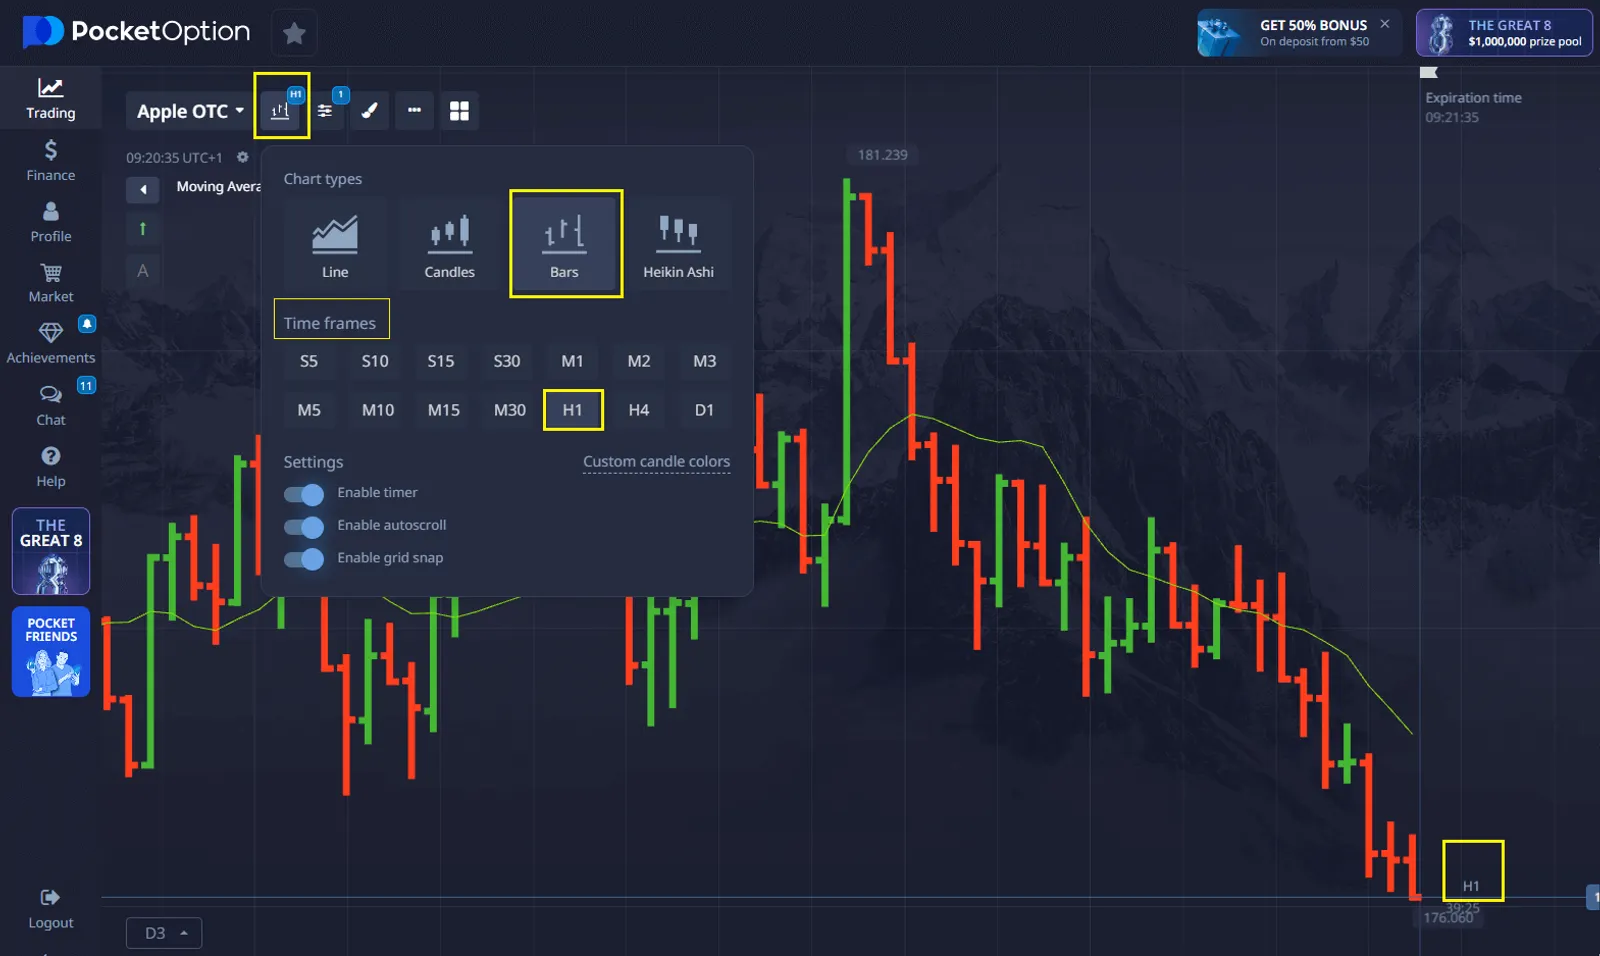
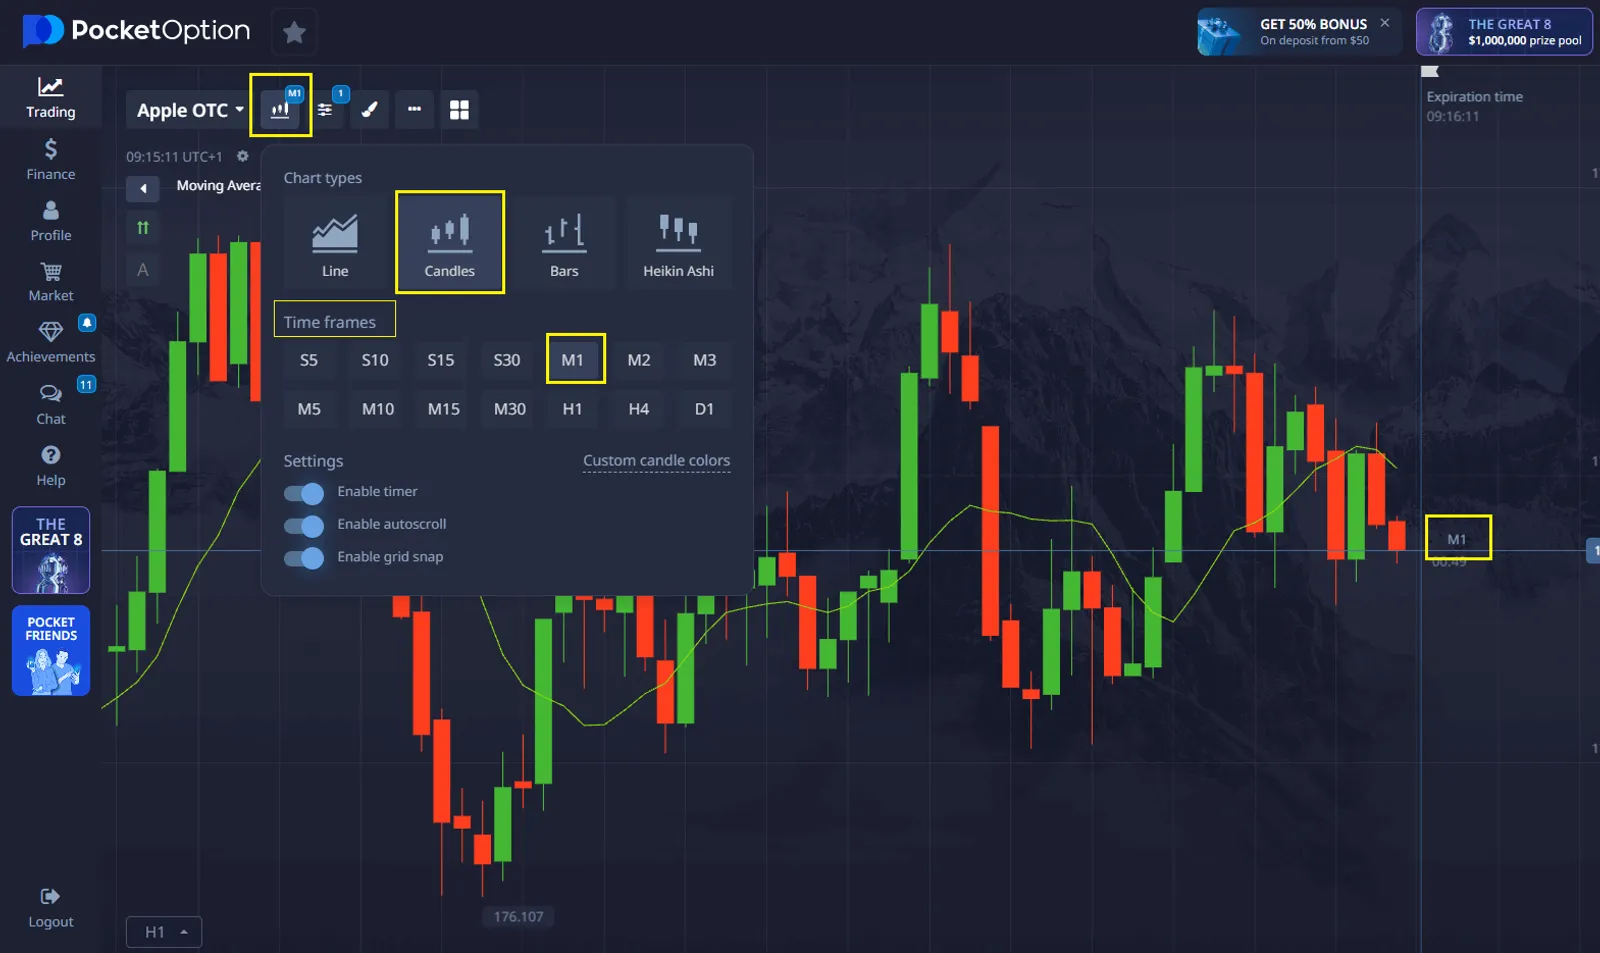
- Shorter time frames (e.g. 1 minute, 5 minutes) are ideal for day traders and scalpers who are looking to make quick trades.
- Longer time frames (e.g. 1 hour, 4 hours) are better suited for swing traders or those analyzing broader trends.
- Market analysis: This allows you to focus on specific market movements and trends, helping you make informed trading decisions.
- Trading Accuracy: By choosing the right time frame, you can better time your entries and exits, improving your overall trading efficiency.
Best Time Frame for Day Trading Strategies

Choosing the right time frame is a fundamental aspect of day trading success. Each time interval offers unique insights into price movements and market trends. The choice of what time frame is best for day trading depends on your strategy and goals.
Time frame in trading refers to the specific length of time represented by each candle, bar or point on a chart. For example, in a 1-minute time frame, each candle represents 1 minute of price movement, while in a 5-minute time frame, each candle represents 5 minutes of price movement.
Setting a time frame is crucial because it helps you analyze the market in accordance with your trading strategy and goals. Adapt to your trading style:
At Pocket Option, you can easily set the time frame to suit your trading needs and customize your experience.

Below is a summary of the most common time frames and their applications:
| Time Frame | Characteristics | Best for |
|---|---|---|
| 1-minute | High-speed price changes | Scalping and quick trades |
| 5-minute | Balanced volatility | Short-term momentum trading |
| 15-minute | Clear trend signals | Intraday and swing trading |
| 1-hour | Broader market overview | Trend-following and position trading |
To enhance your analysis, many traders combine multiple time frames. For example:
- Scalping strategies: Use the 1-minute chart for entry points and the 5-minute chart for confirmation.
- Momentum trading: Combine the 5-minute chart for analysis and the 15-minute chart for broader trend support.
- Trend-following strategies: Pair the 15-minute and 1-hour charts to identify long-term trends.
The best time frame for day trading depends on your strategy and preferences. On Pocket Option, in Quick Trading mode, you can select time frames starting from as short as 5 seconds up to a maximum of 1 day, making it suitable for various trading approaches.
- 1-minute chart: Ideal for quick trades and scalping strategies.
- 5-minute chart: Balances speed and analysis, suitable for short-term trades.
- 15-minute chart: Offers a broader view of trends while remaining relevant for intraday trading.
Pocket Option allows you to customize expiration times to align with your strategy, whether it’s fast-paced scalping or trend-following. This flexibility helps traders adapt to market conditions and optimize their performance.

To set the time frame on Pocket Option, follow these steps:
- Open the trading platform on your device.
- Find the Time Frame option on the chart interface.
- Click on it to see the available time frames.
- Select your preferred time frame from the list (e.g. 5 seconds, 1 minute, 5 minutes, etc.).
This will set up the chart to display data based on the selected time frame, which will help you analyze the market more effectively.
The best time frame for day trading often depends on the technical analysis tools and indicators you use. Pocket Option provides comprehensive charting capabilities across various time frames, enabling traders to apply their preferred strategies effectively. Below are some key considerations when using technical analysis tools:
- Moving Averages Analysis
- Support and Resistance Levels
- Volume Indicators
- Momentum Oscillators
The table below outlines some popular technical indicators, their recommended time frames for day trading, and their typical applications:
| Indicator | Best Chart Time Frame for Day Trading | Application |
|---|---|---|
| RSI | 5-minute | Overbought/Oversold |
| MACD | 15-minute | Trend Direction |
| Bollinger Bands | 5-minute | Volatility |
By aligning the chosen indicators with the appropriate time frames, traders can enhance their decision-making process and improve the accuracy of their trades.
Selecting the best time frame for day trading requires understanding market dynamics and personal trading style. Successful traders often combine multiple time frames for comprehensive analysis. The key is maintaining consistency and adapting to market conditions while using appropriate technical tools. Focus on developing a systematic approach to time frame selection based on your trading goals and market conditions.
FAQ
What factors determine the best time frame for day trading?
Key factors include trading style, market volatility, asset class, and personal risk tolerance. Shorter time frames suit aggressive trading, while longer intervals work better for trend following.
How do multiple time frame analysis improve trading decisions?
Multiple time frame analysis provides broader market context, helps confirm trends, and identifies potential entry and exit points across different intervals.
Which technical indicators work best with different time frames?
Fast-moving indicators like RSI work well with shorter time frames, while trend indicators like moving averages are more effective on longer intervals.
Why is market session timing important for time frame selection?
Different market sessions have varying volatility levels and trading volumes, affecting the optimal time frame choice for specific trading strategies.
How should beginners approach time frame selection in day trading?
Beginners should start with longer time frames (15-minute charts) to reduce noise and develop pattern recognition skills before moving to shorter intervals.