- The market discounts everything – all information (news, expectations, economic factors) is already incorporated into the price.
- Prices move in trends – these can be upward (bullish), downward (bearish), or sideways.
- History repeats itself – market behavior patterns tend to reoccur.
Technical Analysis in Finance

On Pocket Option you will learn how to identify trends, analyze price movements, and use proven tools like Moving Averages, RSI, and Fibonacci Retracements. Whether you trade stocks, forex, or crypto, discover practical techniques to manage risk and improve your strategy.
Try it on Pocket Option! Technical analysis (TA) is a method for evaluating financial markets based on the study of price movements and trading volumes. Unlike fundamental analysis, which examines a company's financial and economic indicators, TA focuses on price dynamics, assuming that all necessary information is already reflected in an asset's market value.
Pocket Option stands out by offering traders a complete set of instruments for thorough market analysis. The platform integrates various features, ensuring traders have everything they need for technical analysis.
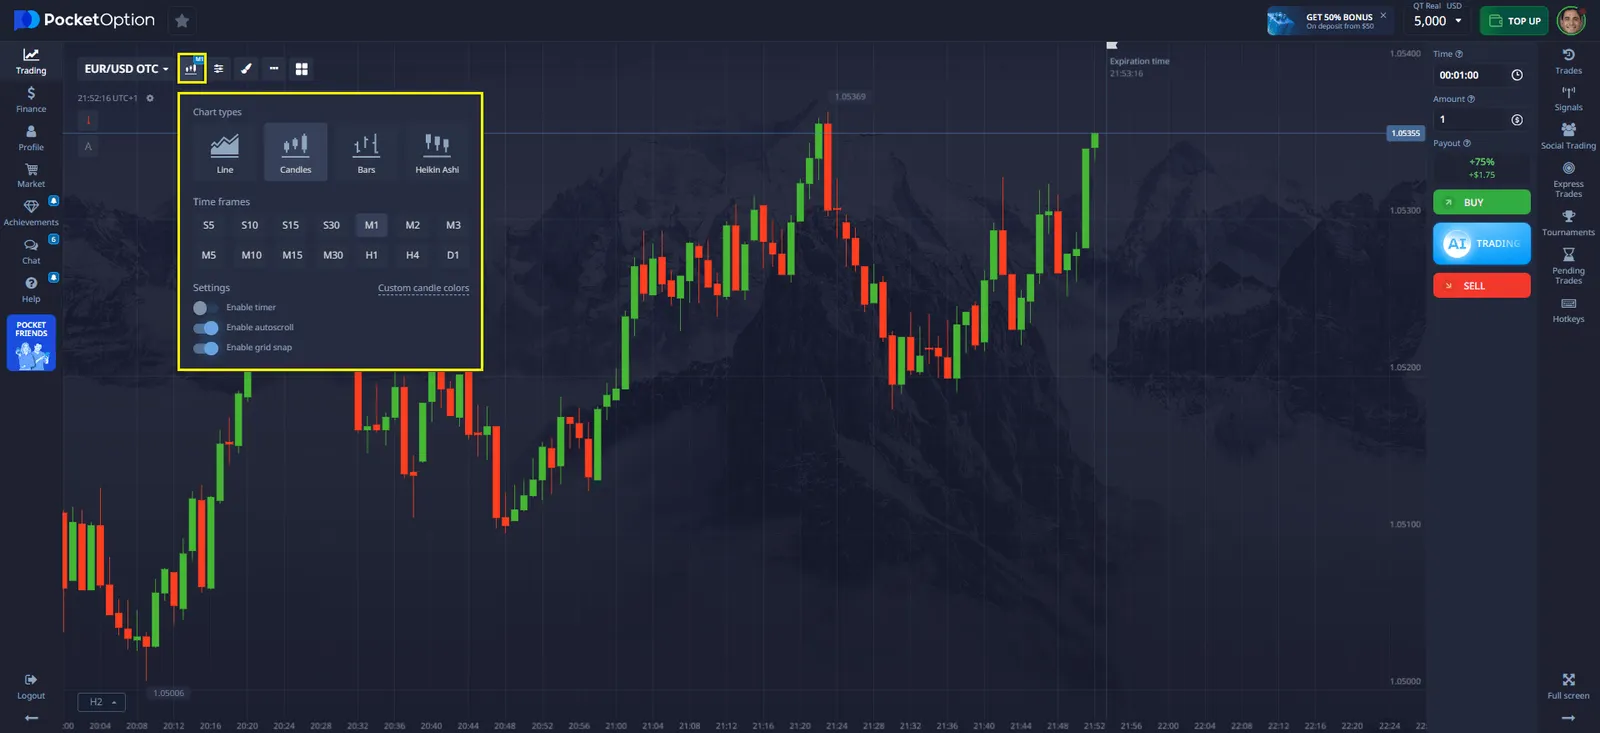
Chart types are essential tools in technical analysis, providing different perspectives on price action and market trends. Each type serves a specific purpose, helping traders make informed decisions based on their trading style and strategy.
- Visualizing Price Movements – Charts like Japanese candlesticks and bar charts display detailed price action, making it easier to spot trends, reversals, and patterns.
- Simplifying Trend Analysis – Line charts eliminate market noise and focus on overall direction, helping traders see long-term trends.
- Smoothing Out Volatility – Heiken Ashi charts filter out minor price fluctuations, making trends clearer and reducing false signals.
- Assessing Market Strength – Bar charts provide key price points (open, high, low, close), offering insights into volatility and market sentiment.

Timeframes play a crucial role in market analysis, helping traders adapt their strategies based on short-term or long-term trends. Pocket Option provides a wide range of timeframes, from seconds to months, allowing traders to choose the most suitable one for their approach.
- Short timeframes (1M, 5M, 15M) – Ideal for scalping and short-term trades, capturing quick price movements.
- Medium timeframes (1H, 4H, 1D) – Suitable for swing trading and identifying stable trends.
- Long timeframes (1W, 1M) – Best for long-term investors analyzing broader market trends.
Choosing the right chart type and timeframe helps traders analyze the market more effectively and develop better trading strategies.
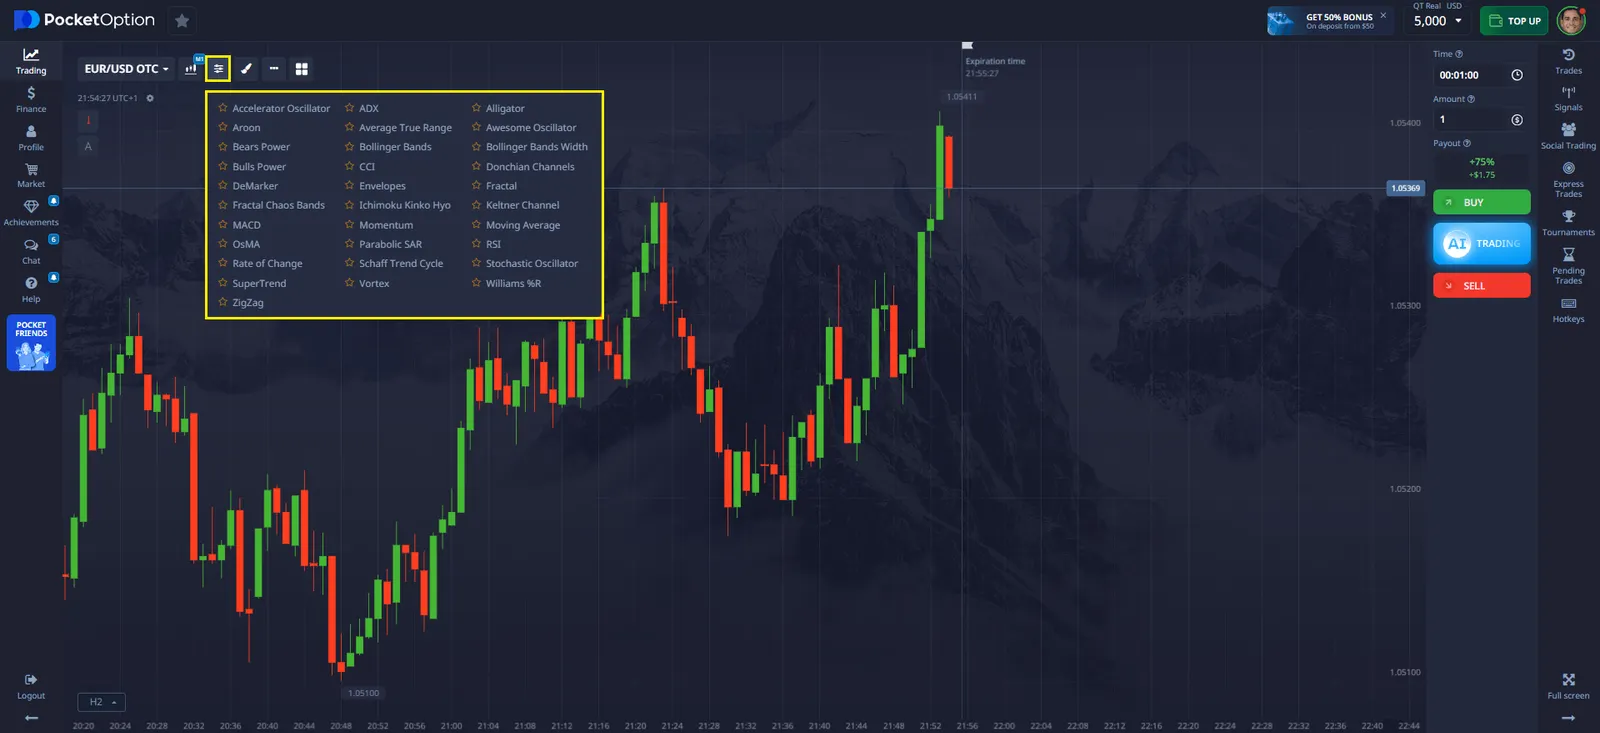
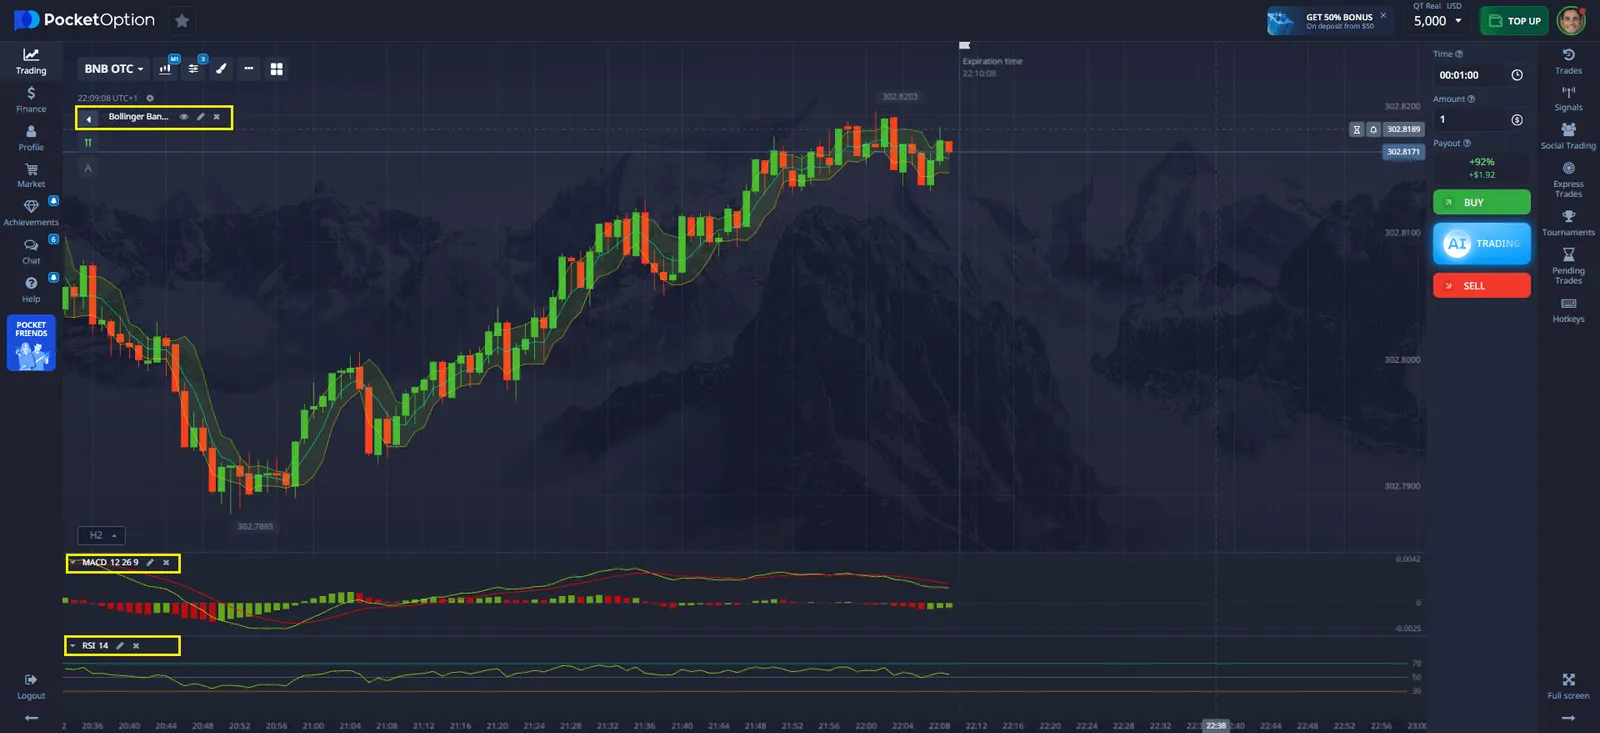
Indicators are essential tools in technical analysis, helping traders analyze price movements, identify trends, and make informed decisions. They provide valuable insights into market conditions, momentum, volatility, and potential reversals. Pocket Option supports an extensive list of 30+ indicators, categorized as follows:
Trend Indicators:
- Moving Averages (SMA, EMA) – Identifies trend direction and strength.
- MACD – Shows momentum shifts and possible reversals.
- Parabolic SAR – Assists in determining stop-loss placement and trend direction.
Momentum Indicators:
- RSI – Measures overbought or oversold conditions.
- Stochastic Oscillator – Compares closing price to price range over a set period.
- CCI – Detects cyclical trends and overbought/oversold levels.
Volatility Indicators:
- Bollinger Bands – Identifies periods of high and low volatility.
- ATR – Measures market volatility and potential price movement.
Volume Indicators:
- OBV – Tracks buying and selling pressure.
- Volume Profile – Displays traded volume at various price levels.
Custom Indicators:
- Ability to add personalized studies for enhanced trading insights.

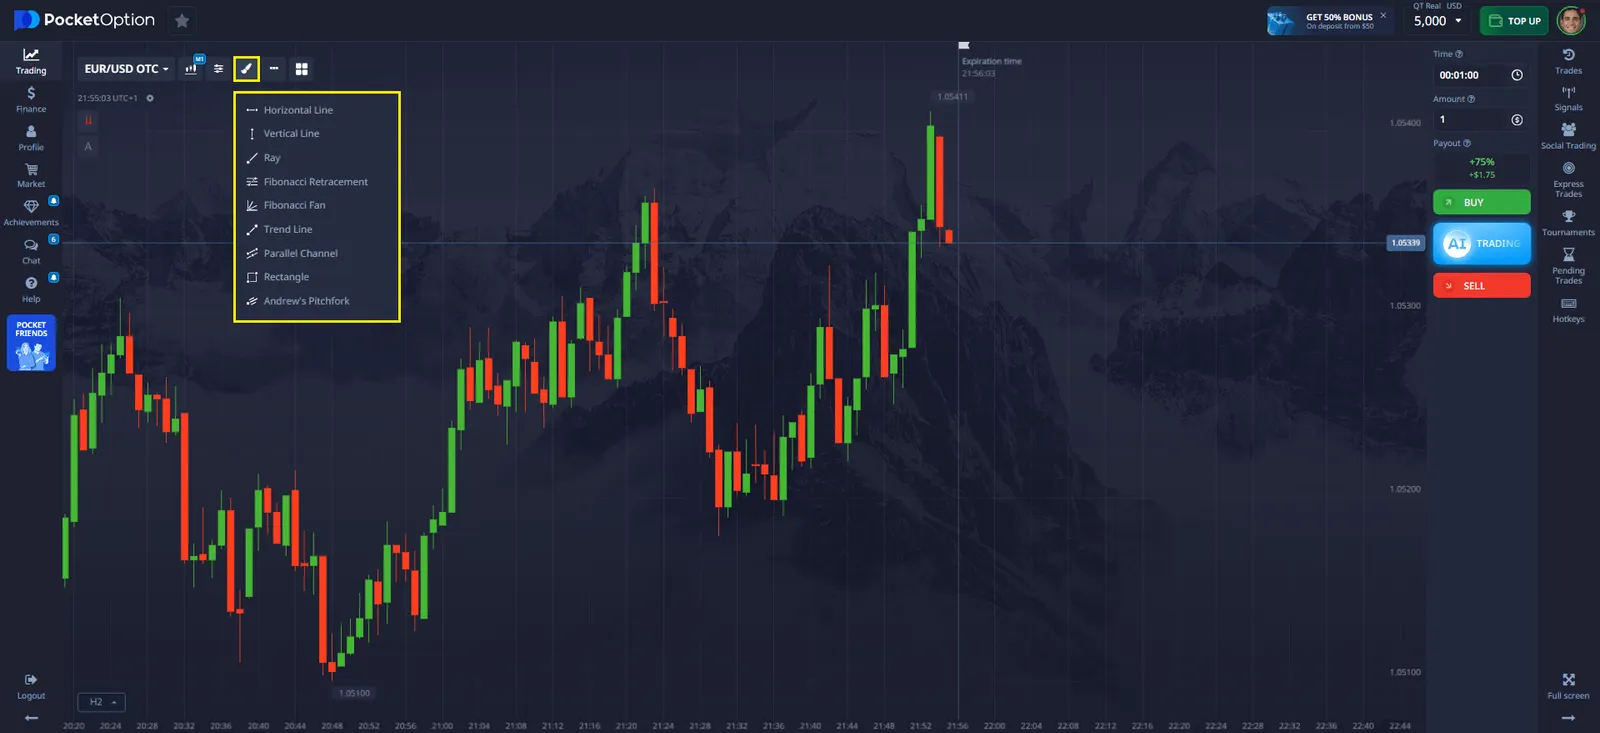
Drawing tools are essential for technical analysis, helping traders visualize market structure, identify key levels, and make informed decisions. These tools provide insights into trends, potential reversals, and price patterns, making it easier to develop effective trading strategies.
- Identify Trends – Tools like trend lines, parallel channels, and Andrews' Pitchfork help traders recognize the direction of the market and potential trend reversals.
- Mark Key Levels – Support and resistance levels, horizontal lines, and Fibonacci retracements highlight crucial price points where price action is likely to react.
- Track Time and Price Movements – Vertical lines help analyze market behavior at specific time intervals, while ray lines extend to capture long-term trends.
- Measure Volatility and Consolidation – Rectangles highlight price consolidation zones, while Fibonacci fans offer insights into retracement levels.
By using these drawing tools effectively, traders can better anticipate price movements, refine entry and exit points, and enhance overall trading precision.

Use it on Pocket Option free:
- Trend Lines – Helps determine market direction.
- Fibonacci Retracements – Identifies potential support and resistance levels.
- Support and Resistance Levels – Crucial for identifying key price points.
- Horizontal Line – Marks fixed support and resistance levels.
- Vertical Line – Helps track specific time points on a chart.
- Ray Line – Extends infinitely in one direction to highlight key trends.
- Fibonacci Fan – Uses diagonal lines to identify potential retracement levels.
- Parallel Channel – Defines price movement within a trend using two parallel lines.
- Rectangle – Highlights consolidation zones where price moves within a range.
- Andrews' Pitchfork – Identifies trends and potential reversals using three parallel lines.
Don’t miss out on the powerful technical analysis capabilities that Pocket Option offers. Join thousands of successful traders who have already discovered the advantage of trading with professional-grade tools.
- Sign up now and receive access to all technical analysis features!
- Start with a demo account to practice risk-free!
- Join our trading community and elevate your trading strategy!
Remember: Success in trading comes from proper analysis and risk management. Pocket Option provides you with all the tools you need – it’s time to put them to work!
Let’s examine how traders utilize Pocket Option’s tools in a Bitcoin trade. A trading opportunity arose when multiple technical signals aligned, indicating a strong buying setup.
| Primary Analysis | Confirmation Signals | Trade Execution |
|---|---|---|
| The 50-day EMA crossed above the 200-day EMA, forming a "Golden Cross," which is a bullish signal. | The MACD histogram displayed increasing bullish momentum, supporting the idea of an upward move. | Entry Point: $43,500 |
| The RSI indicated an oversold condition at 30, suggesting a potential price rebound. | The Volume Profile indicated a strong support level at the entry point. | Stop Loss: Below the 0.786 Fibonacci level |
| Bollinger Bands showed price compression, a sign that a breakout might occur. | The Fibonacci retracement tool placed the price at the 0.618 level, a common reversal zone. | Take Profit: Upper Bollinger Band |

For traders interested in forex, let’s analyze a trade with the EUR/USD currency pair. A profitable trade setup emerged using a combination of technical indicators.
Sample Trade Analysis
| Primary Analysis | Confirmation Signals | Trade Execution |
|---|---|---|
| The 200-day SMA confirmed an overall uptrend. | The RSI was at 40, signaling a potential price reversal. | Entry Point: 1.0950 |
| The Fibonacci retracement was at the 50% level, indicating a strong support zone. | The MACD crossover suggested a bullish momentum shift. | Stop Loss: 1.0900 |
| The Volume Profile confirmed a key support level at the entry point. | The Bollinger Bands showed expansion, signaling increasing volatility and a potential price move. | Take Profit: 1.1050 |
This example illustrates how traders can leverage Pocket Option’s built-in tools to analyze and execute trades effectively.
By utilizing Pocket Option’s technical indicators and drawing tools, traders can perform similar analyses to identify high-probability trades.
| Advanced Features of Technical Analysis | User Experience Benefits |
|---|---|
| Real-time data updates for accurate decision-making. | Intuitive interface for effortless navigation. |
| Multiple timeframe analysis for better trade execution. | Quick tool access to save time. |
| 30+ Custom indicator settings to tailor strategies. | Customizable workspace to suit individual preferences. |
| Advanced charting capabilities that improve visibility. | Mobile compatibility for trading on the go. |
| Seamless tool integration for enhanced efficiency. | Responsive performance for a smooth trading experience. |
Ready to begin your technical analysis journey? Here’s how:
- Create your account today
- Access the full suite of technical tools
- Practice with a demo account before trading live
- Apply analysis to real trading for improved accuracy
- Combine multiple indicators for confirmation before entering trades.
- Use different timeframes for a comprehensive market view.
- Keep your charts clean and organized to avoid clutter.
- Start with basic indicators before advancing to complex ones.
- Regular practice leads to better pattern recognition and decision-making.
Ready to transform your trading? Sign up with Pocket Option today and access our complete suite of technical analysis tools!
FAQ
What is technical analysis, and how does it help in trading?
Technical analysis is a method of predicting price movements based on historical data and chart patterns. It helps traders identify trends, support and resistance levels, and optimal entry and exit points for trades.
What technical indicators are available on Pocket Option?
Pocket Option offers a wide range of indicators, including Moving Averages (SMA, EMA), MACD, RSI, Stochastic, Bollinger Bands, Parabolic SAR, CCI, and the ability to add custom indicators for personalized analysis.
How can I combine multiple indicators for better trading decisions?
To increase accuracy, traders often use a combination of indicators. For example, trend indicators like EMA can be paired with oscillators such as RSI or Stochastic to confirm entry points and reduce false signals.
How can I analyze currency pairs using technical analysis?
Analyzing forex pairs involves studying trend indicators, identifying support and resistance levels, and using candlestick patterns. For example, when trading EUR/USD, traders can use the 200-day SMA to determine trend direction and MACD for confirmation.
Can I perform technical analysis on mobile version?
Yes, Pocket Option provides a fully functional mobile platform with all technical analysis tools, including charts, indicators, and drawing tools, allowing traders to analyze the market and trade on the go.